Last year, an analyst I worked with received 12 quarterly PDF reports from a client — each one containing a financial summary table. His job was to combine the data into a single spreadsheet for trend analysis. He copied and pasted each table manually. It took him an entire afternoon. When he was done, his totals did not match the source documents. Two columns had silently shifted during pasting, and three cells contained numbers stored as text that Excel's SUM formula ignored. He spent another hour finding and fixing the errors.
That story captures the core problem with PDF table extraction: it looks like a simple copy-paste task, but it is actually a data integrity problem. In five-plus years of working with document automation and PDF workflows — and as someone who works with data pipelines day to day — I have found that the extraction itself is rarely the hard part. The hard part is getting clean, trustworthy data out the other end.
This guide covers the different types of PDF tables you will encounter, the methods available for extracting them, what typically goes wrong during extraction, and a post-extraction validation checklist that catches the errors most people miss.
Why PDF Tables Are Harder to Extract Than They Look
This is the foundational concept that explains every problem covered in this guide.
A PDF does not store tables. It stores individually positioned text fragments on a page. What looks like a neatly organized table with rows and columns is actually dozens of separate text strings placed at specific x,y coordinates on the page. The PDF has no concept of "this is row 3, column B." It does not know that six pieces of text are a row, or that a vertical stack of numbers is a column. It just knows where each character sits (Zheng et al., 2020).
When an extraction tool pulls a table from a PDF, it has to reverse-engineer the structure. It scans the page for patterns — aligned text, consistent spacing, drawn lines — and guesses where rows and columns exist. This is pattern recognition, not data extraction. The tool is inferring structure that was never explicitly defined in the file.
This is why the same table can extract perfectly from one PDF and produce garbage from another. The difference is not in the tool — it is in how the table was built inside the PDF.
The Five Types of PDF Tables (And Why Each One Matters)
Not all PDF tables are created equal. Identifying what type you are working with before you start extracting is the single most impactful step you can take — because it determines which method will work and how much cleanup to expect (Sahoo et al., 2020).
1. Text-based bordered tables
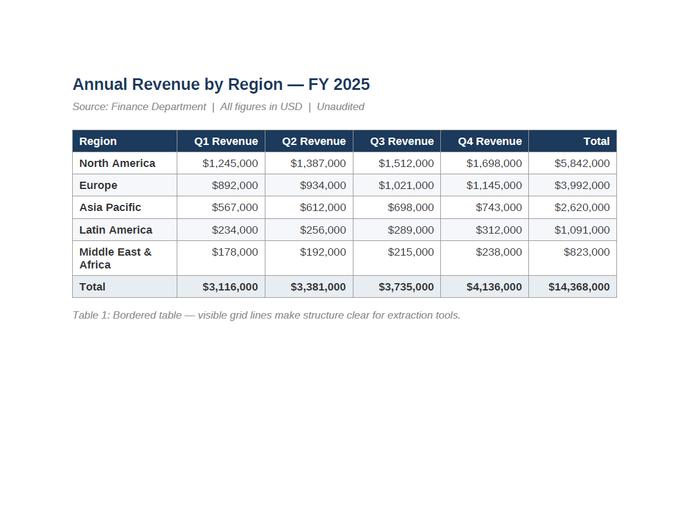
[Screenshot: bordered-table.pdf — clean financial table with visible grid lines, dark header row, alternating row shading.]
This is the best-case scenario. The table has visible borders separating every row and column, and the text is digitally embedded (you can highlight and copy it). Extraction tools can detect the grid lines, identify cell boundaries, and place values into the correct columns with high accuracy. If every PDF table looked like this, extraction would be a solved problem.
2. Text-based borderless tables
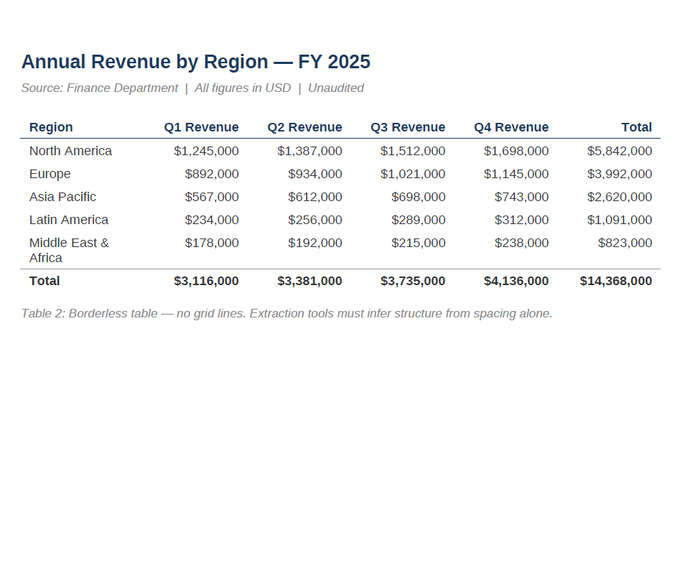
[Screenshot: borderless-table.pdf — identical data, but no cell borders. Only a header underline and spacing separate the columns.]
Same data, dramatically harder to extract. Without visible grid lines, the extraction tool must infer column boundaries from text alignment and spacing alone. This is where column shifts happen — the tool guesses where one column ends and another begins, and it guesses wrong. Borderless tables are the single most common source of extraction errors in our experience.
3. Scanned image tables
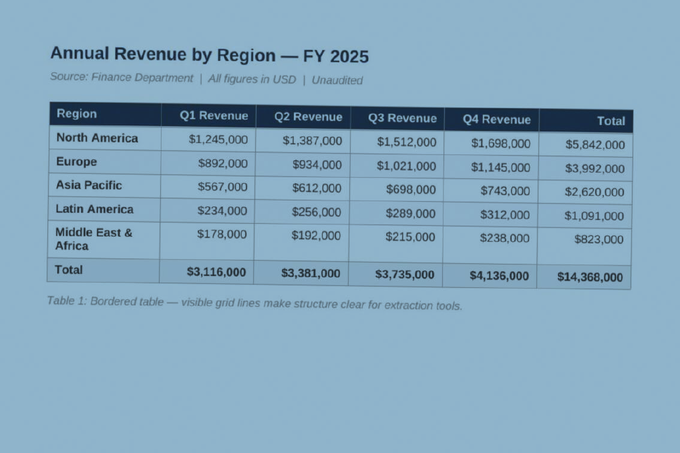
[Screenshot: scanned-table.pdf — the same table photographed and re-embedded as an image. Slight tilt, reduced contrast, subtle blur.]
This is not a table at all — it is a photograph of a table. The PDF contains an image, not text. You cannot highlight or copy anything. Before any extraction can happen, the image must go through OCR (Optical Character Recognition) to convert the pixels into machine-readable text. The quality of the scan directly determines the quality of the extraction. Blurry scans, tilted pages, low resolution, and unusual fonts all increase OCR error rates.
4. Multi-page tables
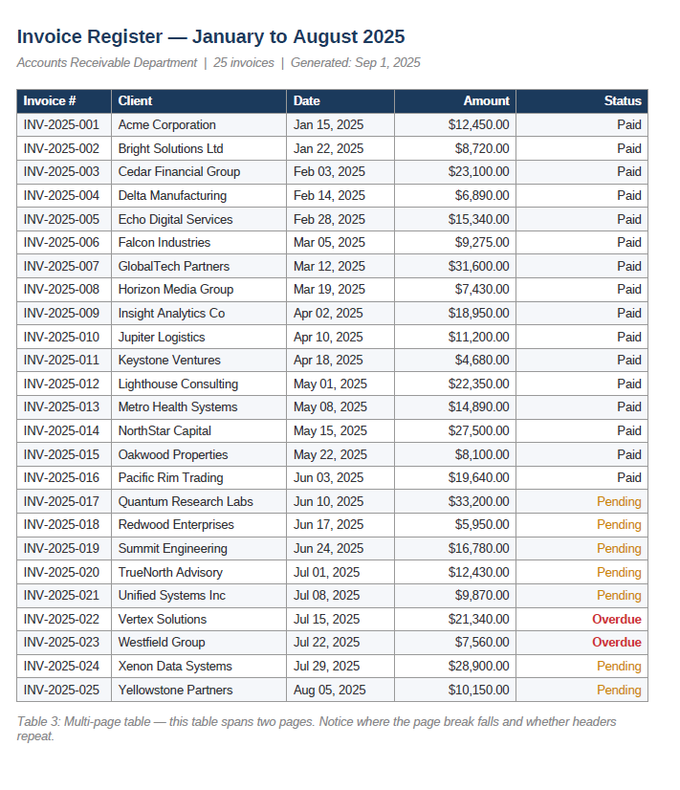
[Screenshot: multipage-table.pdf — a 25-row invoice register that spans the full page. In longer documents, this table would split across a page break.]
When a table spans multiple pages, extraction gets complicated. Column headers may repeat on each page (creating duplicate header rows in the output). Rows may split across the page break. Footnotes and page numbers can get pulled into the table data. The extracted result often needs manual cleanup to remove duplicate headers and reconnect split rows.
5. Tables with merged cells and irregular structure
These tables have cells that span multiple columns or rows, nested headers, or mixed content types within cells. They are the hardest type to extract accurately because the tool cannot map the irregular structure into a clean row-and-column grid. Complex tables with heavy merging often require manual reconstruction after extraction.
Why this classification matters: if you can identify the table type before extracting, you can choose the right method and set realistic expectations. A bordered text-based table can go straight through a browser conversion tool. A scanned borderless table needs OCR first and will almost certainly require manual cleanup.
Extraction Methods: An Honest Comparison
Each method has a specific sweet spot. Choosing the wrong one wastes time; choosing the right one saves hours.
Manual copy-paste
Best for: one-off extraction of a single small table (under 20 cells) from a text-based PDF. You highlight the table, copy, and paste into Excel. For tiny tasks this is faster than loading any tool. For anything larger, it is error-prone and tedious — pasted data often loses column structure, and you spend more time reformatting than you would have spent using a proper tool.
Browser-based conversion tools (PDF Doctor, iLovePDF, Smallpdf)
Best for: text-based PDFs with simple to moderate table structures, when you need a quick result without installing software. Upload the PDF, get an Excel or CSV file back. PDF Doctor's PDF-to-Excel and PDF-to-CSV tools handle this workflow. These tools work well for bordered tables and reasonably well for simple borderless tables. They are the fastest path from PDF to spreadsheet for everyday users. Limitation: complex layouts, merged cells, and scanned documents will need more specialized approaches.
Desktop table extraction software (Tabula)
Best for: researchers, analysts, and anyone who regularly extracts tables from PDFs and needs more control. Tabula (free, open-source) lets you visually draw a selection box around exactly the table region you want to extract — useful when a page has multiple tables or surrounding text that should not be included. It handles borderless tables better than most browser tools because you define the extraction region manually. Limitation: does not handle scanned PDFs (no built-in OCR).
Python libraries (tabula-py, camelot, pdfplumber)
Best for: developers and data professionals who need to extract tables programmatically, process many PDFs in batch, or integrate extraction into an automated pipeline. Camelot specifically offers two modes — "lattice" for bordered tables and "stream" for borderless tables — giving you control over how the tool infers structure. Limitation: requires Python knowledge and command-line comfort.
OCR-based extraction (Adobe Acrobat, ABBYY FineReader, OCRmyPDF)
Best for: scanned PDFs where the content is an image, not selectable text. OCR converts the image into machine-readable text first, and then the table can be extracted using any of the methods above. Adobe Acrobat and ABBYY FineReader combine OCR with built-in table detection. OCRmyPDF (free, open-source) adds a text layer to the PDF, which you can then process with Tabula or a conversion tool. Limitation: OCR accuracy depends heavily on scan quality — blurry, tilted, or low-resolution scans produce unreliable text.
What Goes Wrong During Extraction — With Visual Proof
These are the errors that silently corrupt your data if you do not catch them. Each one is illustrated by the broken extraction example we created for this guide.
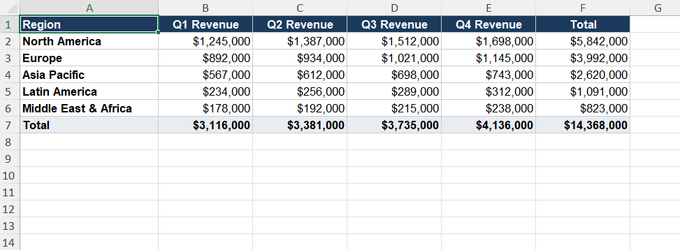
[Screenshot: clean-extraction.xlsx — the revenue data properly in columns, numbers formatted as currency, right-aligned. This is what a successful extraction looks like.]
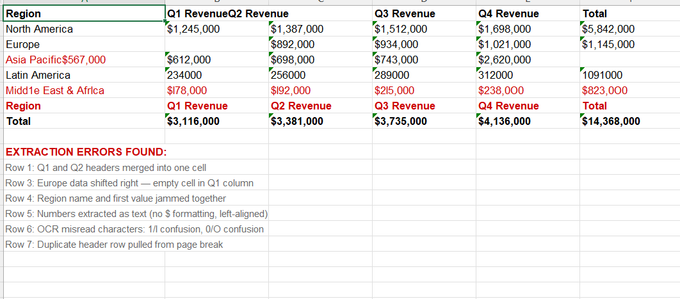
[Screenshot: broken-extraction.xlsx — the same data with every common error highlighted: merged headers, shifted columns, text-as-numbers, OCR character confusion, and a duplicate header row.]
Column shift from empty cells. When a cell in the original table is empty, the extraction tool may shift all subsequent values one column to the left. In the broken example, Europe's Q1 value is missing, pushing every number in that row into the wrong column. This is the most dangerous extraction error because it is not obvious at a glance — the spreadsheet still looks full of data, but every value is in the wrong place.
Headers merged into one cell. The tool sometimes fails to separate adjacent column headers, jamming "Q1 Revenue" and "Q2 Revenue" into a single cell. This breaks any automated processing that relies on header names to identify columns.
Region name fused with data. When the extraction tool cannot find the boundary between the first column (text) and the second column (numbers), it concatenates them. "Asia Pacific" becomes "Asia Pacific$567,000" — a single text string that is useless for analysis.
Numbers stored as text. The extracted values look like numbers but are actually text strings. Excel's SUM, AVERAGE, and other formulas ignore them, returning zero. This is the error the analyst in my opening example missed — and it is extremely common. You can identify it by checking whether numbers are left-aligned (text) or right-aligned (numbers) in Excel.
OCR character confusion. When extracting from scanned documents, OCR frequently confuses visually similar characters: lowercase L (l) and the number 1, uppercase O and the number 0. In the broken example, "178,000"became"178,000" became " 178,000"became"l78,000" — a text string that no formula can process. These errors are invisible unless you specifically look for them (Balsiger et al., 2024).
Duplicate header rows from page breaks. When a table spans multiple pages, the extraction tool may re-detect the header row on each page and include it as a data row. The broken example shows the header row appearing again in the middle of the data, which would corrupt any calculation, pivot table, or chart built from the dataset.
The Post-Extraction Validation Checklist
This is the section the original version of this article was missing — and it is arguably the most important part. Extraction is step one. Validation is what makes the data trustworthy.
Check column count. Open the extracted file and count the columns. Does the number match the original table? If the original has 6 columns and the extraction has 5 or 7, something merged or split incorrectly.
Check row count. Count the data rows (excluding headers). Compare against the original. If the counts do not match, look for missing rows (especially at page breaks) or duplicate header rows inserted in the middle.
Spot-check values against the original. Pick 5–10 cells at random — including the first row, the last row, and at least one row near a page break — and verify them against the source PDF. This catches column shifts, OCR errors, and fused values.
Verify totals. If the original table has a total row, add up the extracted column values and compare. If the sums do not match, you have either missing values, extra values (duplicates), or numbers stored as text.
Check number formatting. Select a column of numbers and try a SUM formula. If it returns zero, the values are stored as text. In Excel, use Data → Text to Columns or the "Convert to Number" option to fix this. Also check that currency symbols, decimal points, and negative signs survived correctly.
Look for duplicate headers. Scroll through the entire dataset and look for header rows repeated in the middle. This is common with multi-page tables and will corrupt any analysis if not removed.
Verify reading order. For borderless tables and tables extracted from multi-column pages, confirm that the data rows are in the correct sequence. Text from adjacent columns can sometimes interleave during extraction.
Decision Tree: Which Method Should You Use?
Rather than listing strengths and weaknesses abstractly, here is a practical decision path.
Step 1: Can you highlight and copy text from the PDF table?
- Yes → it is text-based. Go to Step 2.
- No → it is scanned. Run OCR first (Adobe Acrobat, ABBYY FineReader, or OCRmyPDF), then return to Step 1.
Step 2: Does the table have visible borders (grid lines)?
- Yes → bordered table. A browser conversion tool (PDF Doctor, iLovePDF) will handle it well for simple tables. For complex tables or batch processing, use Tabula or camelot (lattice mode).
- No → borderless table. Go to Step 3.
Step 3: How complex is the borderless table?
- Simple (consistent columns, no merged cells) → try a browser tool first. Review carefully for column shifts.
- Complex (merged cells, irregular spacing, nested headers) → use Tabula (manual region selection) or camelot (stream mode). Expect manual cleanup.
Step 4: How many PDFs are you processing?
- One or a few → browser tool or Tabula.
- Many (batch processing) → Python library (tabula-py, camelot, pdfplumber) for automation.
Tips for the Best Results
Identify the table type before choosing a method — bordered vs. borderless vs. scanned determines your approach. Always run the post-extraction validation checklist before using the data. For scanned documents, improve scan quality before OCR: crop margins, straighten pages, increase contrast. If the table has no borders, try Tabula with manual region selection — it gives you more control than automated tools. For multi-page tables, check for duplicate header rows after extraction. Keep the original PDF open alongside the extracted spreadsheet during validation — side-by-side comparison is the fastest way to spot errors. If accuracy is critical (financial data, research data, regulatory reporting), spot-check at least 10% of values against the source.
Wrapping Up
Extracting tables from PDFs is not a copy-paste task — it is a data quality task. The extraction step takes seconds. The validation step takes minutes. Skipping validation is how shifted columns, text-as-numbers, and OCR errors end up in your analysis, your report, or your client deliverable.
The key to reliable extraction: identify the table type first, choose the right method for that type, and always validate the output before using it. For simple bordered tables, a browser conversion tool gets you there in seconds. For anything more complex, the right combination of tools and manual review produces data you can actually trust.
PDF-to-Excel and PDF-to-CSV conversion tools are available at https://pdfsdoctor.com/.
References
Balsiger, L., et al. (2024). Frequency of data extraction errors and methods to increase data extraction quality: a methodological review. BMC Medical Research Methodology.
Sahoo, S., et al. (2020). Automatic detection and extraction of tables and their content from PDF documents. Proceedings of the International Conference on Document Analysis and Recognition, 1–5.
Zheng, X., et al. (2020). Global table extractor (GTE): A framework for joint table identification and cell structure recognition using visual context. Winter Conference on Applications of Computer Vision.
TEXUS: A unified framework for extracting and understanding tables in PDF documents. (2019). Information Systems, 895–918.
An automatic selective PDF table-extraction method for collecting materials data from literature. (2025). Digital Discovery.
Digitization of Document and Information Extraction using OCR. (2023). International Journal of Computer Applications, 1–6.